
The geoperu package provides a convenient interface to access official spatial datasets of Peru directly from R. These data are collected from the National Institute of Statistics and Informatics (INEI) of Peru.
Installation
Install the released version of geoperu from CRAN:
install.packages("geoperu")Install the development version from GitHub with pak:
pak::pak("PaulESantos/geoperu")To access spatial information of districts from any province in Peru, you can use the get_geo_peru() function.
library(geoperu)
#> This is geoperu 0.0.1

cusco <- geoperu::get_geo_peru(geography = "CUSCO",
                               level = "dep",
                               simplified = FALSE,
                               showProgress = FALSE)
cusco
#> Simple feature collection with 112 features and 4 fields
#> Geometry type: MULTIPOLYGON
#> Dimension:     XY
#> Bounding box:  xmin: -73.9811 ymin: -15.45829 xmax: -70.34507 ymax: -11.21229
#> Geodetic CRS:  WGS 84
#> First 10 features:
#>    departamento    provincia       distrito        capital
#> 1         CUSCO      ESPINAR       PICHIGUA       PICHIGUA
#> 2         CUSCO      ESPINAR    SUYCKUTAMBO SUYCKUTAMBO /5
#> 3         CUSCO      ESPINAR       PALLPATA  HECTOR TEJADA
#> 4         CUSCO      ESPINAR        ESPINAR          YAURI
#> 5         CUSCO QUISPICANCHI ANDAHUAYLILLAS ANDAHUAYLILLAS
#> 6         CUSCO        CALCA          LARES          LARES
#> 7         CUSCO CHUMBIVILCAS         LLUSCO         LLUSCO
#> 8         CUSCO      ESPINAR        OCORURO        OCORURO
#> 9         CUSCO        CALCA          CALCA          CALCA
#> 10        CUSCO      ACOMAYO   MOSOC LLACTA   MOSOC LLACTA
#>                              geom
#> 1  MULTIPOLYGON (((-71.18148 -...
#> 2  MULTIPOLYGON (((-71.51302 -...
#> 3  MULTIPOLYGON (((-70.97839 -...
#> 4  MULTIPOLYGON (((-71.36934 -...
#> 5  MULTIPOLYGON (((-71.6563 -1...
#> 6  MULTIPOLYGON (((-71.90762 -...
#> 7  MULTIPOLYGON (((-72.10355 -...
#> 8  MULTIPOLYGON (((-71.05453 -...
#> 9  MULTIPOLYGON (((-71.87228 -...
#> 10 MULTIPOLYGON (((-71.43954 -...
cusco_simplified <- geoperu::get_geo_peru(geography = "CUSCO",
                                          level = "dep",
                                          simplified = TRUE,
                                          showProgress = FALSE)
cusco_simplified
#> Simple feature collection with 1 feature and 1 field
#> Geometry type: POLYGON
#> Dimension:     XY
#> Bounding box:  xmin: -73.9811 ymin: -15.45829 xmax: -70.34507 ymax: -11.21229
#> Geodetic CRS:  WGS 84
#>   departamento                           geom
#> 1        CUSCO POLYGON ((-70.8315 -14.0698...

prov_sf <- geoperu::get_geo_peru(geography = "ANTA",
                                 level = "prov",
                                 simplified = TRUE,
                                 showProgress = FALSE)
prov_sf
#> Simple feature collection with 1 feature and 1 field
#> Geometry type: POLYGON
#> Dimension:     XY
#> Bounding box:  xmin: -72.77286 ymin: -13.71406 xmax: -72.00001 ymax: -13.28477
#> Geodetic CRS:  WGS 84
#>   provincia                           geom
#> 1      ANTA POLYGON ((-72.11767 -13.396...
islay_sf <- geoperu::get_geo_peru(geography = "ISLAY",
                                  level = "prov",
                                  simplified = FALSE,
                                  showProgress = FALSE)
islay_sf
#> Simple feature collection with 6 features and 5 fields
#> Geometry type: MULTIPOLYGON
#> Dimension:     XY
#> Bounding box:  xmin: -72.22384 ymin: -17.28501 xmax: -71.30225 ymax: -16.67504
#> Geodetic CRS:  WGS 84
#>              tag departamento provincia        distrito          capital
#> 1 arequipa_islay     AREQUIPA     ISLAY PUNTA DE BOMBON  PUNTA DE BOMBON
#> 2 arequipa_islay     AREQUIPA     ISLAY           MEJIA            MEJIA
#> 3 arequipa_islay     AREQUIPA     ISLAY           ISLAY ISLAY (MATARANI)
#> 4 arequipa_islay     AREQUIPA     ISLAY      COCACHACRA       COCACHACRA
#> 5 arequipa_islay     AREQUIPA     ISLAY   DEAN VALDIVIA         LA CURVA
#> 6 arequipa_islay     AREQUIPA     ISLAY        MOLLENDO         MOLLENDO
#>                             geom
#> 1 MULTIPOLYGON (((-71.44018 -...
#> 2 MULTIPOLYGON (((-71.8306 -1...
#> 3 MULTIPOLYGON (((-71.99808 -...
#> 4 MULTIPOLYGON (((-71.48244 -...
#> 5 MULTIPOLYGON (((-71.76488 -...
#> 6 MULTIPOLYGON (((-71.66772 -...
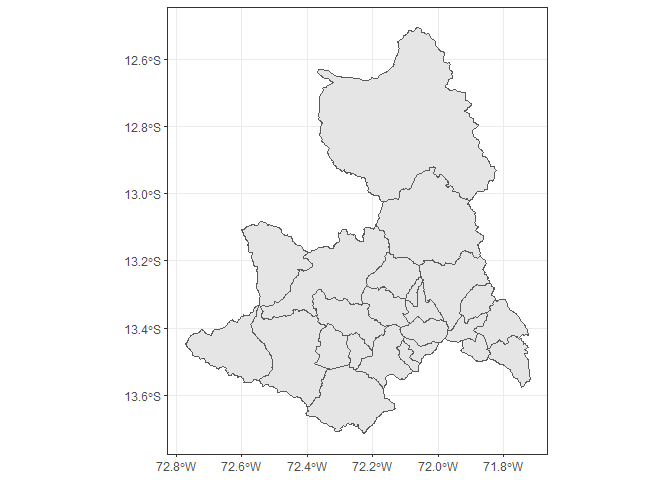
The objects returned by geoperu work directly with ggplot2. A restrained grey scale, fine district borders, and a geographic grid produce a clear, technical map of Cusco:
library(ggplot2)

ggplot() +
  geom_sf(
    data = cusco,
    aes(fill = provincia),
    color = "#FFFFFF",
    linewidth = 0.15
  ) +
  geom_sf(
    data = cusco_simplified,
    fill = NA,
    color = "#374151",
    linewidth = 0.7
  ) +
  scale_fill_grey(start = 0.35, end = 0.8, guide = "none") +
  coord_sf(expand = FALSE) +
  labs(
    title = "CUSCO",
    subtitle = "Provincias y límites distritales",
    caption = "Datos: INEI · Mapa: geoperu"
  ) +
  theme_minimal(base_size = 11) +
  theme(
    plot.background = element_rect(fill = "#FAFAF9", color = NA),
    panel.background = element_rect(fill = "#FAFAF9", color = NA),
    panel.grid = element_line(color = "#E5E7EB", linewidth = 0.3),
    axis.text = element_text(color = "#6B7280", size = 7),
    plot.title = element_text(color = "#1F2937", size = 18, face = "bold"),
    plot.subtitle = element_text(color = "#4B5563"),
    plot.caption = element_text(color = "#6B7280")
  )
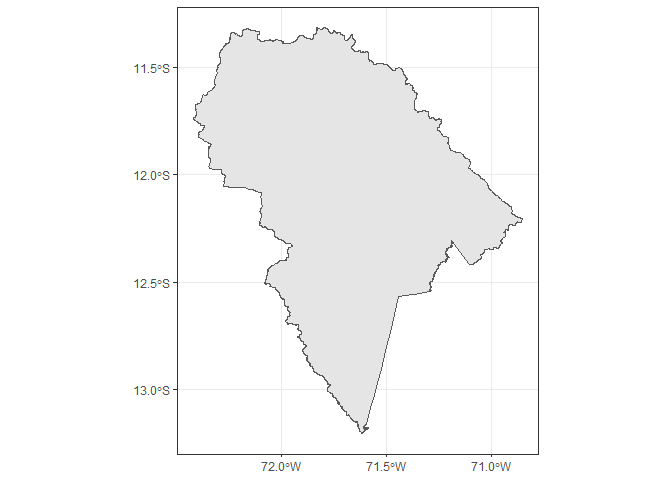
geoperu also provides access to spatial information of natural protected areas in Peru. These areas, managed and declared by the National Service of Natural Areas Protected by the State (SERNANP), encompass a diverse range of ecosystems. The get_anp_peru() function allows users to download spatial data representing these protected areas directly into their R environment.
manu <- get_anp_peru(anp = "manu", showProgress = FALSE)
manu
#> Simple feature collection with 1 feature and 4 fields
#> Geometry type: POLYGON
#> Dimension:     XY
#> Bounding box:  xmin: -72.41719 ymin: -13.2059 xmax: -70.85217 ymax: -11.31585
#> Geodetic CRS:  WGS 84
#>          anp_cate anp_nombre anp_sect              anp_ubpo
#> 1 Parque Nacional       Manu     <NA> Cusco y Madre de Dios
#>                             geom
#> 1 POLYGON ((-71.36212 -11.656...

manu |>
  ggplot() +
  geom_sf(fill = "#AAB7B0", color = "#3F5148", linewidth = 0.7) +
  coord_sf(expand = FALSE) +
  labs(
    title = "PARQUE NACIONAL\nDEL MANU",
    subtitle = "Cusco y Madre de Dios",
    caption = "Datos: SERNANP · Mapa: geoperu"
  ) +
  theme_minimal(base_size = 11) +
  theme(
    plot.background = element_rect(fill = "#FAFAF9", color = NA),
    panel.background = element_rect(fill = "#FAFAF9", color = NA),
    panel.grid = element_line(color = "#E5E7EB", linewidth = 0.3),
    axis.text = element_text(color = "#6B7280", size = 7),
    plot.title = element_text(
      color = "#26332D", size = 16, face = "bold", hjust = 0,
      lineheight = 0.9
    ),
    plot.subtitle = element_text(color = "#526159"),
    plot.caption = element_text(color = "#6B7280")
  )
These maps use only ggplot2; colors, typography, and line widths can be adapted without modifying the spatial data.