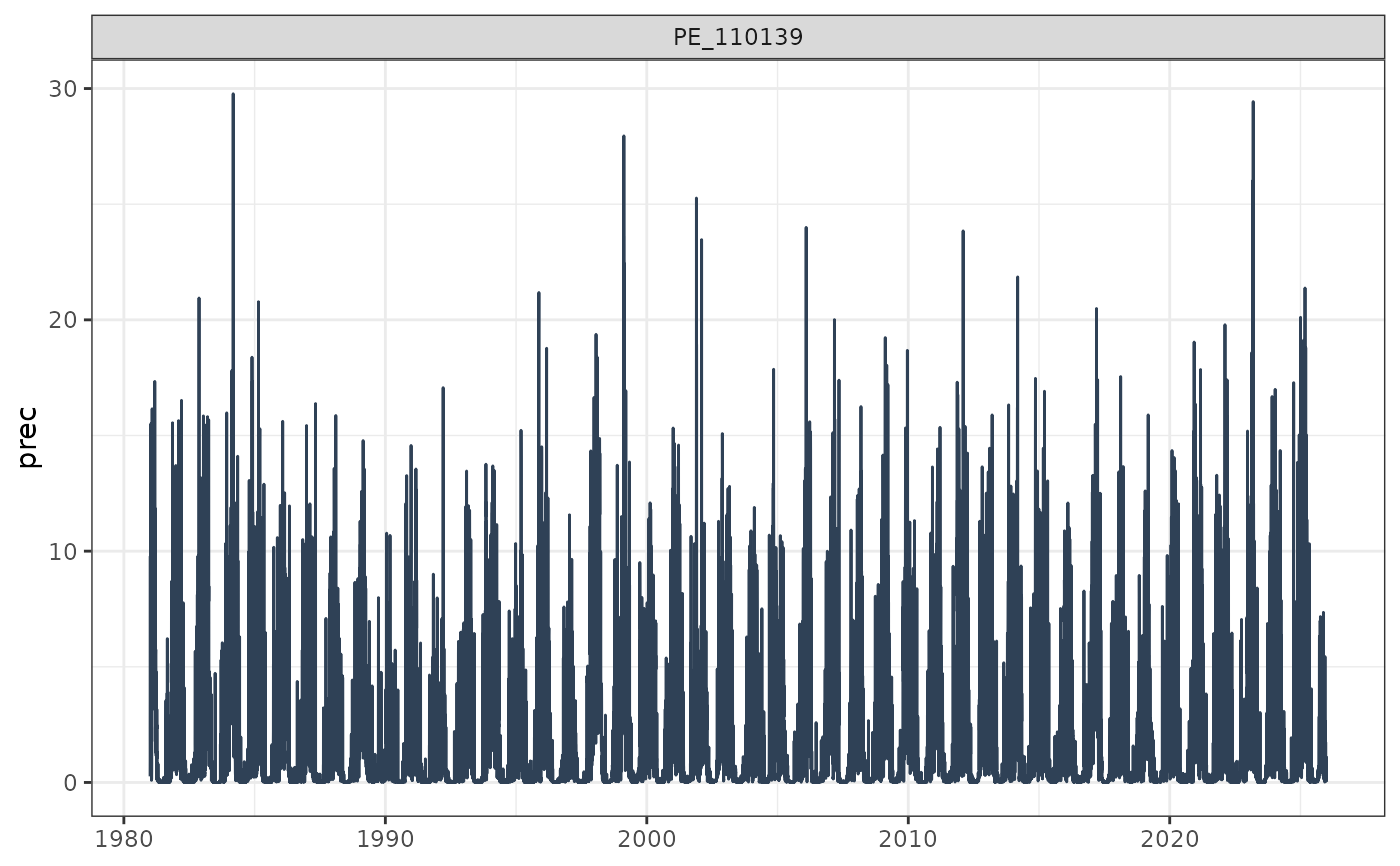
Creates a time series plot for one CAMELS-PE variable, such as precipitation,
observed streamflow, simulated streamflow, or temperature. The function
returns a ggplot object, styled with the project color palette.
Usage
plot_pe_timeseries(
  data,
  variable = "flow_obs",
  gauge_id = NULL,
  date_col = "date",
  facet = TRUE,
  scales = "free_y",
  line_color = "#2F4156",
  ...
)

plot_timeseries(
  data,
  variable = "flow_obs",
  gauge_id = NULL,
  date_col = "date",
  facet = TRUE,
  scales = "free_y",
  line_color = "#2F4156",
  ...
)
Arguments
- data
A data frame containing CAMELS-PE time series.
- variable
Character string. Name of the variable to plot. Default is
"flow_obs".- gauge_id
Optional character vector. Gauge IDs used to filter the data before plotting. If
NULL, all available gauges indataare plotted.- date_col
Character string. Name of the date column. Default is
"date".- facet
Logical value. If
TRUE(default), creates one panel per gauge ID.- scales
Character string. Scales passed to
ggplot2::facet_wrap(). One of"fixed","free","free_x", or"free_y"(default).- line_color
Character string. Line color for the time series. Default is
"#2F4156"(Navy).- ...
Additional arguments passed to
ggplot2::geom_line().
Examples
ts <- load_pe_timeseries(
  gauge_ids = "PE_110139",
  variables = c("prec", "flow_sim")
)
plot_pe_timeseries(ts, variable = "prec")