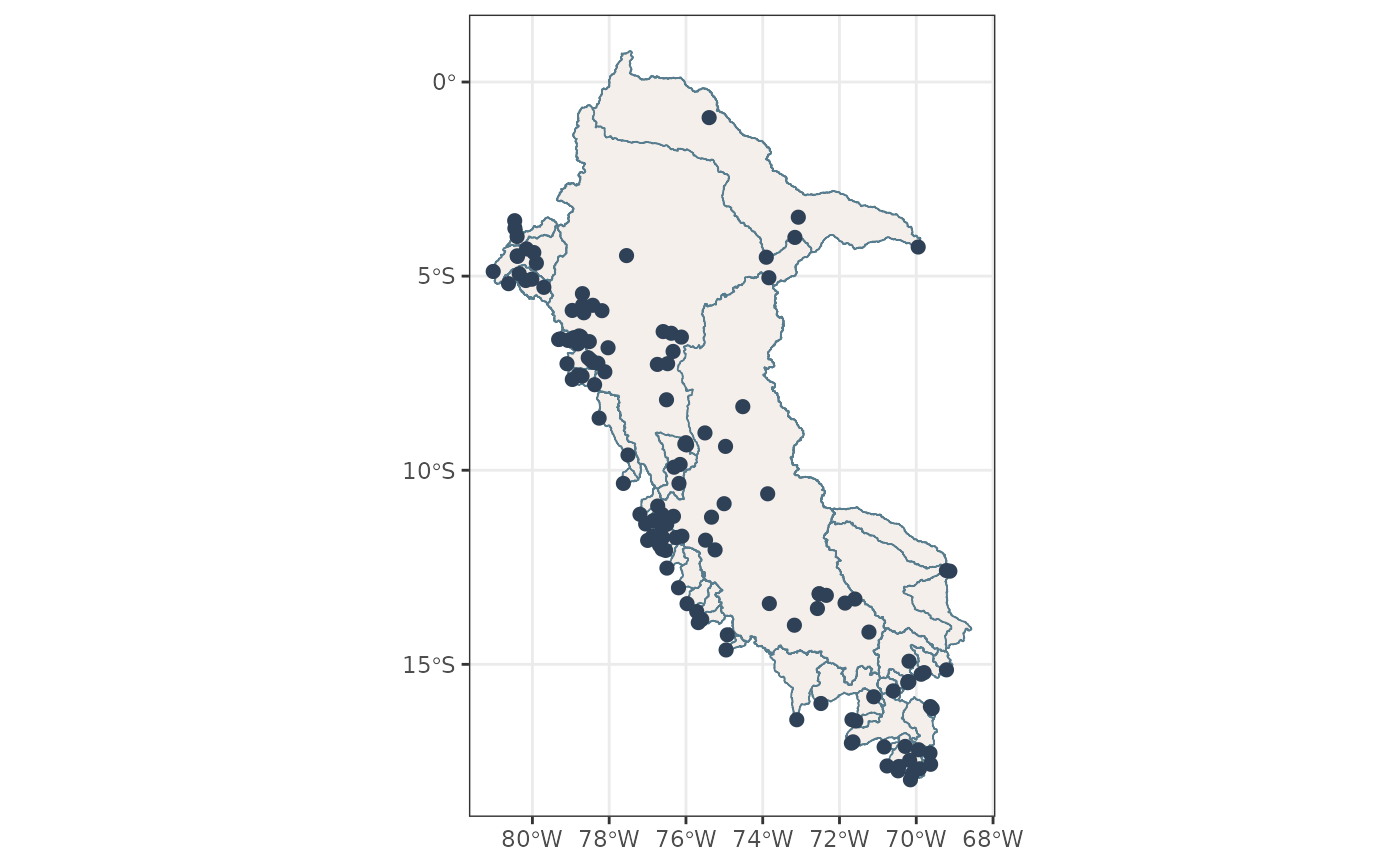
Creates a map of CAMELS-PE catchments and optionally overlays gauge
locations. If gauge_id is provided, only one catchment and its outlet
are plotted, with the gauge ID shown as a panel header.
Usage
plot_pe_catchments(
  catchments,
  gauges = NULL,
  gauge_id = NULL,
  fill = NULL,
  ...
)

plot_catchments(catchments, gauges = NULL, gauge_id = NULL, fill = NULL, ...)
Arguments
- catchments
An
sfobject with catchment polygons.- gauges
Optional
sfobject with gauge point locations.- gauge_id
Optional character string. Gauge ID used to filter one catchment and its gauge before plotting. If
NULL, all catchments are plotted.- fill
Optional character string. Name of a catchment column used to fill polygons. If
NULL, a constant fill is used.- ...
Additional arguments passed to
ggplot2::geom_sf().
Examples
catchments <- load_pe_geospatial(type = "catchments")
gauges <- load_pe_geospatial(type = "gauges")
plot_pe_catchments(catchments, gauges)