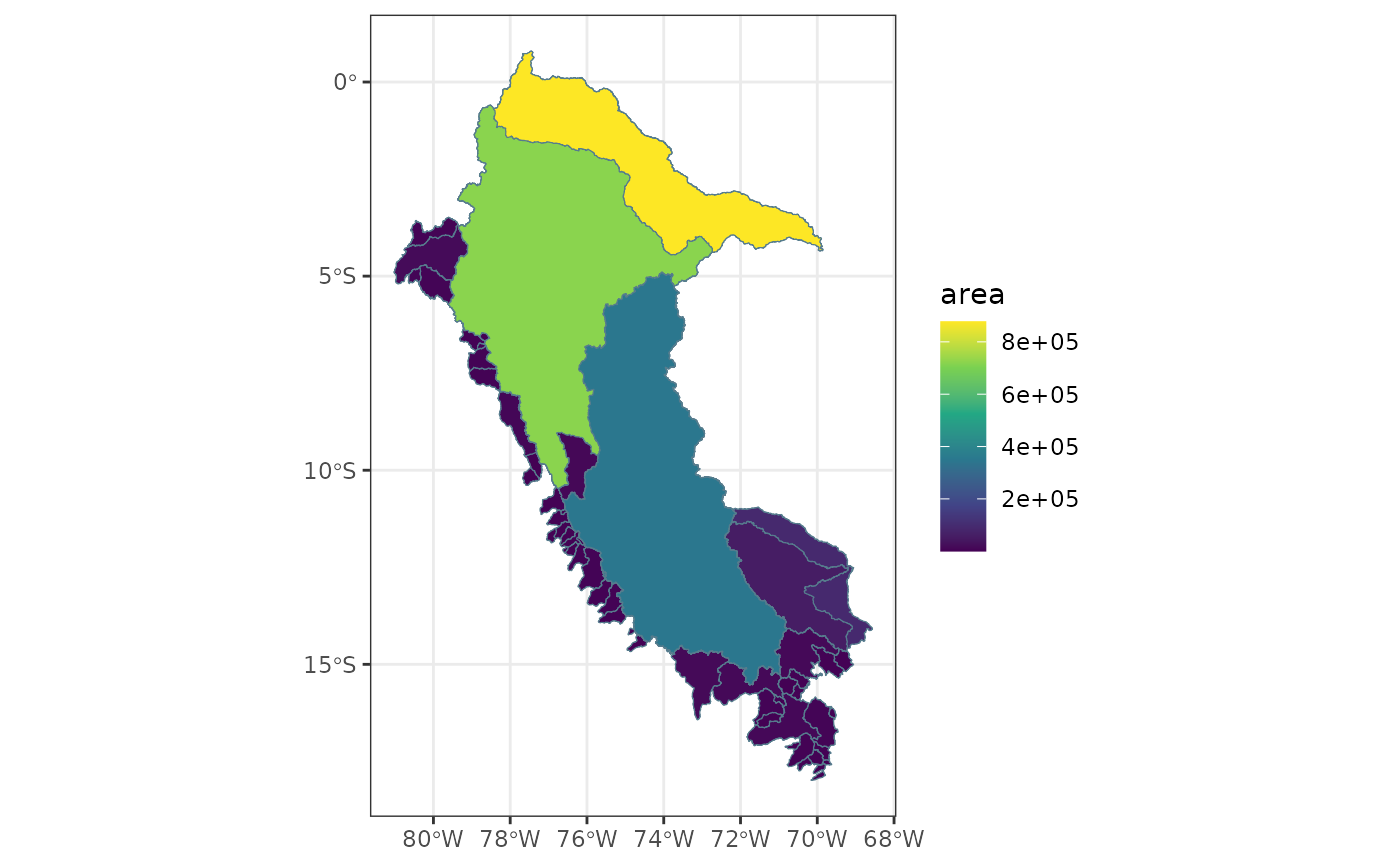
Creates a thematic map of CAMELS-PE catchments using a selected attribute.
The function joins attribute data with catchment geometries by gauge_id
using collapse::join and returns a ggplot object.
Usage
plot_pe_attribute_map(
  catchments,
  attributes,
  variable,
  gauges = NULL,
  na_color = "grey80",
  ...
)

plot_attribute_map(
  catchments,
  attributes,
  variable,
  gauges = NULL,
  na_color = "grey80",
  ...
)
Arguments
- catchments
An
sfobject with catchment polygons.- attributes
A data frame containing CAMELS-PE attributes.
- variable
Character string. Name of the attribute to visualize.
- gauges
Optional
sfobject with gauge point locations.- na_color
Character string. Color for missing values. Default is
"grey80".- ...
Additional arguments passed to
ggplot2::geom_sf()for catchments.
Examples
catchments <- load_pe_geospatial(type = "catchments")
attrs <- load_pe_attributes(attributes = "topographic")
plot_pe_attribute_map(catchments, attrs, variable = "area")